A frequent question posed to optical suppliers and manufacturers is: “What is the difference between Root Mean Square (RMS) and Peak-to-Valley (P-V)?” RMS and P-V are both methods for describing how well the shape of an object matches its designed curvature, called “surface figure" and "surface roughness," respectively. An understanding of RMS and P-V is critical in order to prevent over- or under-specifying the parts of an optical system.
P-V and RMS are both calculated from the same data, such as an interferometer measurement, but the meanings are quite different.
- P-V Is the difference in height between the highest and lowest points on the surface. P-V is good at giving a “worst-case-scenario” for the surface.
- RMS is a method for describing the average deviation of the surface figure from the desired surface. RMS is good for describing the overall surface variation.
There is not a simple relationship between P-V and RMS. Some people make the error of using a conversion of 3.5 to determine P-V from an RMS value. This is only good for a rough order of magnitude estimate and should not be used as an absolute value. A large RMS generally corresponds to a large P-V, but the converse is not true - a surface can have a large P-V but a low RMS. There are factors such as waveform or profile shape for what is being measured and also whether the error is uniformly distributed or biased to one location or direction. For example, consider a surface that is relatively smooth but has a large “bump.”
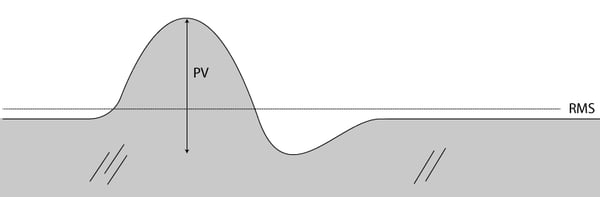
From this example you can see that the overall RMS is small, but the P-V will be large because of the bump in height.
Another important factor to consider is the size of the region over which the surface figure is measured. Increasing the area of measurement will usually decrease the RMS. This is because, for an optical element that is relatively smooth, having more points to average means that small regions of variation have less of an effect. By contrast, however, increasing the area of measurement will always increase the P-V because the larger area increases the chance that an even larger deviation will appear.
Here are four best practices for using RMS and P-V as surface specifications:
-
Perform careful optical analysis to study how variations in surface figure affect the performance. It is usually best to look at overall system performance rather than each individual component. By analyzing the entire system, it is easier to identify which optical elements have surfaces whose smoothness most impacts the performance of the entire system. For example, wavefront errors can impact image quality, and surface roughness errors could result in increased scatter that might saturate your detector or cause signal-to-noise impacts.
-
Consider your application. The desired output of the system usually establishes worst-case scenarios that need to be captured by a hard limit on the P-V and also determine the size of the measurement region used for qualification.
-
Agree on the metrology equipment that your supplier will be using for quality testing. Something as simple as the camera resolution can affect P-V and RMS calculations. It’s best if you can establish a specific instrument to be used for all your tests. At the very least, establish the brand and model of equipment that will be used.
-
Agree on the method of calculation when determining P-V and RMS. Factors such as the number of measurements to average, the sample rate of integration, and whether Zernike polynomials are used to “baseline” the P-V are all important.
When used correctly, P-V and RMS specifications are valuable for ensuring that the surface figure of an optical element matches your performance requirements. The two numbers can create a common, quantitative point of comparison between the customer and the supplier, and they are a nice “shorthand” for overall surface figure without the heavy detail of Zernike fits. It is critical, though, that the customer and supplier calculate and interpret the values correctly and consistently. To ensure correct final performance, you want a supplier with knowledge, experience, and integrity. At Ross we pride ourselves in helping you get the best performance for the best value— the cost of your parts can be dramatically impacted by seemingly arbitrarily derived values. Give us a call and talk to one of our knowledgeable salespeople and expert engineers to discover how we can help you optimally specify your components for your application.